Introduction: Decodifying Institutional Footprints in Modern Currency Markets
In the vast, highly decentralized ecosystem of the global foreign exchange market, where daily turnover consistently eclipses seven trillion dollars, retail traders are constantly searching for predictability. Traditional technical analysis has long promoted lagging indicators, oscillating momentum meters, and geometric chart patterns like triangles, head-and-shoulders, and wedges. While these tools provide structured reference points, they often fail to capture the underlying physics of interbank execution. To achieve consistent profitability, modern currency traders must evolve beyond surface-level aesthetics and learn to read the institutional footprints left behind by central banks, tier-1 market makers, and sovereign wealth funds.
Among the most powerful concepts in modern institutional price action analysis are Order Blocks (OB) and Fair Value Gaps (FVG). These two interconnected phenomena represent the physical manifestation of large-scale capital accumulation and price imbalance. When a major financial institution needs to deploy millions—or billions—of dollars into a currency pair, their execution leaves distinct architectural scars on the candlestick charts. This comprehensive manual explores the structural mechanics of order blocks and fair value gaps, teaching you how to identify these zones, measure market imbalances, and align your trade executions with smart money order flow.
1. What is an Order Block? (The Anatomy of Smart Money Accumulation)
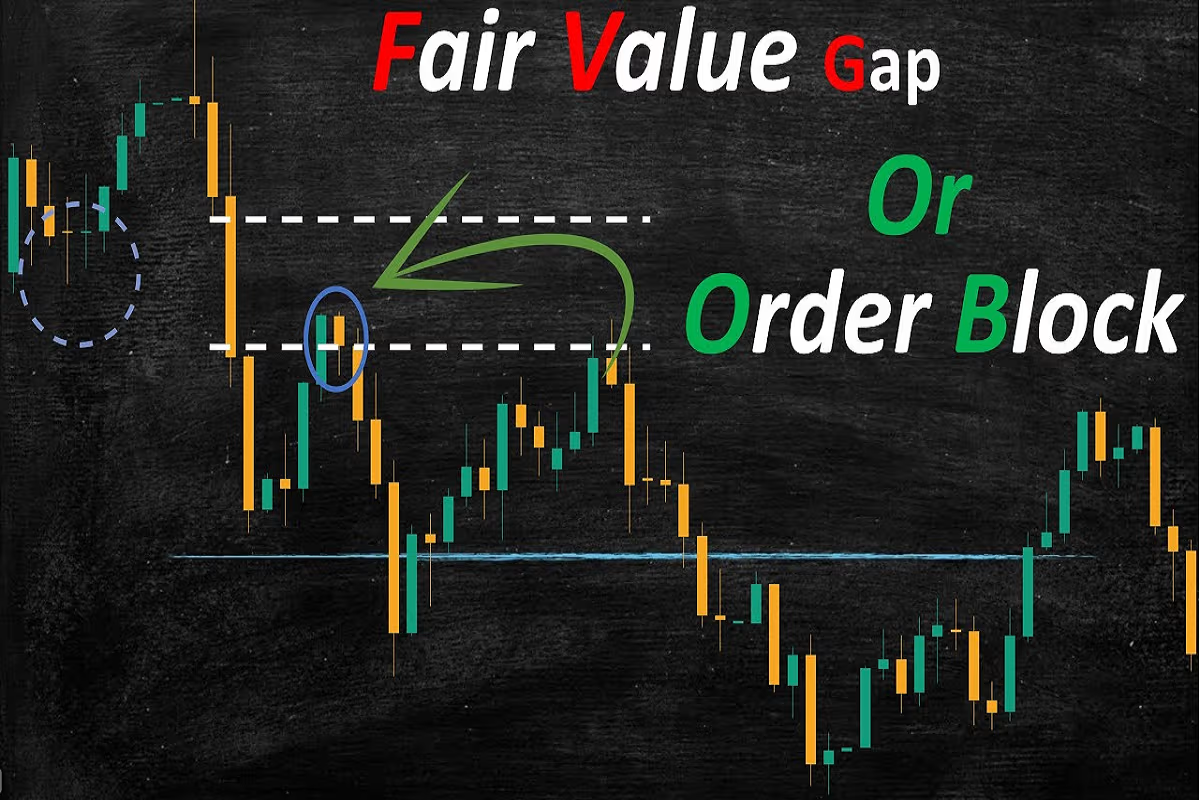
An Order Block refers to the last opposing candle (or cluster of candles) before a powerful, impulsive displacement move that breaks market structure. In simple terms, if an institutional algorithm is preparing to drive a currency pair aggressively upward, it first needs to position its short-term inventory—often by executing engineered selling (or hedging) to induce retail participants into short positions. The final down-candle before the explosive upward expansion represents the exact institutional order block where smart money accumulated its primary long inventory.
The last bearish (red) candle before an aggressive upward displacement that breaks prior structural highs. When price retraces back down to this candle in the future, institutions often defend their original entry zone, providing a high-probability bounce.
The last bullish (green) candle before a violent downward displacement that shatters structural lows. When price rallies back into this zone, institutional resting sell orders reactivate, triggering a strong downward rejection.
Understanding why order blocks work requires examining how institutional order matching functions. Because large institutions cannot execute their entire volume instantly without causing catastrophic slippage, they scale into positions across multiple tranches. The order block represents the footprint of that institutional scaling process—a zone where unmitigated limit orders remain resting on the interbank ledger.
Reference Blueprint: Institutional Order Block vs. Retail Support
fxone.online research labBelow is a structural contrast showing how institutional order blocks differ fundamentally from traditional retail horizontal support and resistance lines.
2. Decoding Fair Value Gaps (FVG): The Physics of Price Imbalance
While order blocks identify where institutional accumulation took place, Fair Value Gaps (FVGs)—often referred to as market imbalances or inefficiencies—reveal the velocity and aggression with which smart money moved price away from those zones. An FVG occurs on a candlestick chart when a powerful, impulsive displacement candle is so rapid and one-sided that the market leaves a three-candle price void where trading occurred without proper two-way auction overlap.
Specifically, looking across a sequence of three consecutive candles (Candle 1, Candle 2, and Candle 3):
-
Bullish Fair Value Gap: Occurs when the high of Candle 1 does not overlap with the low of Candle 3, leaving an unfilled vertical price gap caused by explosive buying pressure in Candle 2.
-
Bearish Fair Value Gap: Occurs when the low of Candle 1 does not overlap with the high of Candle 3, leaving an unfilled vertical price void caused by aggressive institutional selling in Candle 2.
Financial markets abhor vacuums. When an institutional expansion leaves a Fair Value Gap, price frequently retraces back into that imbalance zone to rebalance the order book before resuming its primary macro trend. Professional traders use FVGs as high-probability entry targets and profit-milestone markers.
Visual Masterclass: Trading Order Blocks and FVGs on Major FX Pairs
Watch this intensive visual breakdown analyzing real-time institutional order blocks and fair value gaps on EUR/USD and GBP/JPY during active London and New York sessions.
3. High-Probability Confluence: Combining Order Blocks with FVGs
While trading either order blocks or fair value gaps in isolation can yield positive results, the true edge in institutional price action trading emerges when you combine both concepts into a single confluence model. When an institutional order block aligns perfectly with an unfilled Fair Value Gap within a higher-timeframe discount or premium array, it creates a magnetic reaction zone.
Identify a decisive Market Structure Shift (MSS) on the 4-hour or 1-hour chart where price breaks a major previous swing high or low with strong impulsive momentum.
Isolate the origin of the breakout move. Locate the specific order block candle that initiated the expansion and check if an overlapping Fair Value Gap rests directly above or below it.
Set limit orders at the 50% equilibrium level (OTE zone) of the order block / FVG confluence cluster, placing protective stop-losses safely beyond the structural extreme.
Comparative Analysis: Institutional OB/FVG vs. Retail Indicators
Examine how institutional price action frameworks contrast against traditional retail indicator models in foreign exchange execution.
| Evaluation Metric | Retail Indicator Model (RSI, MACD) | Institutional OB & FVG Framework |
|---|---|---|
| Data Processing | Lagging mathematical transformations of past price | Direct real-time interpretation of raw order flow & candles |
| Entry Precision | Often late due to indicator smoothing calculations | Pinpoint entries at unmitigated institutional ledger zones |
| Stop-Loss Efficiency | Arbitrary placement leading to frequent stop hunts | Strict placement beyond structural order block extremes |
| Market Adaptability | Fails during sideways consolidation and high volatility | Adapts dynamically across all timeframes and asset classes |
During active New York session operations at fxone.online, our analytics desk tracked a textbook bullish order block and fair value gap confluence on USD/JPY. Following an aggressive sweep of Asian session sell-side liquidity at 154.50, institutional algorithms injected massive buy volume, creating a clean 4-hour bullish order block accompanied by an expansive Fair Value Gap between 154.80 and 155.20. When price retraced precisely into this zone three sessions later, resting institutional limit orders absorbed the minor selling pressure, triggering a swift 110-pip upward expansion. Traders utilizing the OB/FVG framework captured this institutional markup with minimal drawdown.
4. Risk Management and Avoiding False Order Block Setups
Not every order block or fair value gap leads to a profitable trade. In fact, trading every visible imbalance without filtering for higher-timeframe context is a common mistake made by novice price action traders. To safeguard your capital, adhere to these rigorous risk protocols:
-
Align with Higher Timeframe Bias: Only trade order blocks and FVGs that align with the daily or 4-hour macroeconomic trend. Counter-trend order blocks have a significantly higher failure rate.
-
Verify Mitigation Status: If price has already tested and mitigated an order block multiple times, its institutional liquidity has been exhausted. Look exclusively for fresh, unmitigated zones.
-
Strict Position Sizing (1% Rule): Never risk more than 1% of your total account equity on a single institutional setup, ensuring long-term mathematical survival across volatile market cycles.
Frequently Asked Questions
What timeframe is best for identifying Order Blocks?
While order blocks can be found on any timeframe, institutional algorithms operate primarily on higher timeframes like the Daily, 4-Hour, and 1-Hour charts. Combining higher-timeframe OBs with 15-minute execution entries yields optimal risk-to-reward ratios.
How do I know if an Order Block has been mitigated?
An order block is considered mitigated once price retraces back into its price boundary after the initial impulsive displacement move. Once tested and filled, subsequent retests of that same zone carry reduced probability.
Summary: Mastering Institutional Precision
Mastering order blocks and fair value gaps transforms how you perceive and interact with foreign exchange currency charts. By shifting your focus from lagging retail indicators to raw institutional order flow mechanics, you begin to see every market swing as a deliberate auction of liquidity and balance. Combining patience, strict risk management, and high-probability OB/FVG confluences allows you to trade shoulder-to-shoulder with smart money operators.
About the Author: FX Research Team, fxone.online
The FX Research Team at fxone.online comprises institutional market analysts, macroeconomic forecasters, and veteran currency traders dedicated to elevating educational standards in retail foreign exchange. Our curriculum cuts through noise, focusing entirely on fundamental catalysts, risk metrics, and structural price mechanics.