Introduction: Unveiling the Invisible Architecture of Global Currency Markets
To the untrained retail eye, foreign exchange charts appear chaotic—a random zig-zag of green and red candlesticks reacting to economic news, retail sentiment, and arbitrary technical indicators. Novice traders draw support and resistance lines connecting previous peaks and troughs, placing their stop-loss orders just beyond those clear structural barriers, only to watch in frustration as price spikes directly through their level, triggers their stop, and instantly reverses in the predicted direction. This recurring phenomenon is dismissed by amateurs as bad luck or broker manipulation. In reality, it is the fundamental mechanics of institutional order flow at work: the hunting of retail liquidity pools.
Global foreign exchange turnover exceeds seven trillion dollars daily. Central banks, multinational corporations, sovereign wealth funds, and tier-1 market-making institutions cannot execute massive multi-billion-dollar positions by simply clicking a market buy or sell button. Doing so would cause severe slippage and drive prices aggressively against their own execution. Instead, smart money operators require deep pools of counterparty liquidity—massive concentrations of pending orders—to fill their institutional volume without moving the baseline valuation unfavorably. This comprehensive guide breaks down the anatomy of liquidity pools, explains why retail stop-losses serve as fuel for institutional accumulation, and teaches you how to align your trading entries with smart money footprints.
1. What Exactly is a Liquidity Pool? (The Fuel of the Interbank Market)
In financial market terminology, liquidity refers to the ease with which an asset can be bought or sold without causing drastic price fluctuations. However, in institutional price action analysis, a "liquidity pool" represents a specific geographic zone on a currency chart where a high concentration of resting orders resides. These orders generally fall into two primary categories: pending stop-loss orders from trapped retail traders and breakout stop-entry orders from momentum chasers.
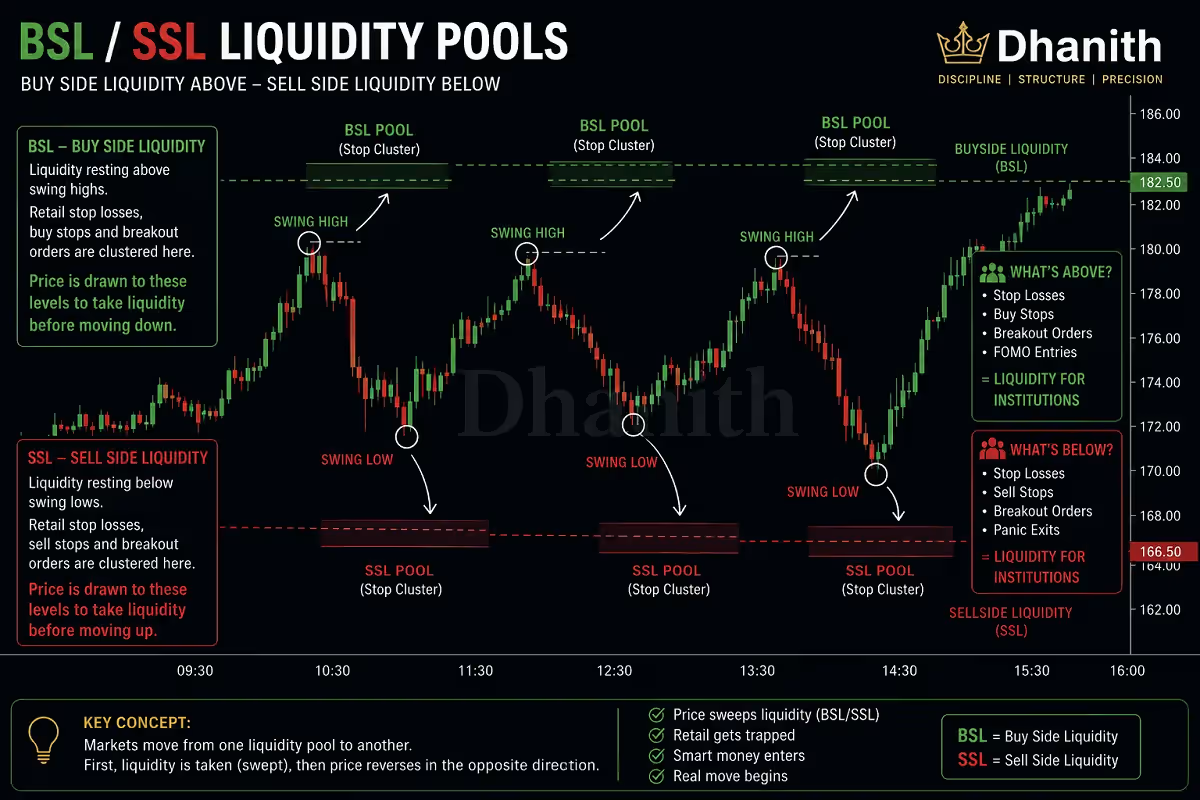
Located above obvious equal highs, double tops, and bearish resistance levels. This zone contains resting stop-loss orders from short sellers and breakout buy-stop orders from momentum traders trying to catch an upside breakout.
Located beneath obvious equal lows, double bottoms, and bullish support levels. This zone houses resting stop-loss orders from long buyers and breakout sell-stop orders from traders expecting a breakdown.
When retail traders place a long trade at a recognized support level, standard risk management dictates placing a stop-loss order just beneath that swing low. When thousands of retail participants execute this identical textbook strategy, their stop-losses cluster tightly together. Because a stop-loss order to sell becomes a market sell order when triggered, these clusters form deep liquidity pools that institutions target when they need massive buy-side volume.
Reference Blueprint: Institutional Order Flow vs. Retail Stop Placement
fxone.online research labBelow is a structural mapping showing how retail stop clusters form pools of liquidity that institutional algorithms deliberately target before executing major directional expansions.
Visualizing Institutional Stop Hunts on Major Currency Pairs
Watch this detailed masterclass analyzing live price action on EUR/USD and GBP/USD during London and New York session openings to spot liquidity sweeps in real-time.
2. The Anatomy of a Stop Hunt: How Smart Money Manipulates Price
A stop hunt (often referred to as a liquidity sweep, stop raid, or inducement) occurs when institutional algorithms drive exchange rates past a clear structural high or low to trigger resting stop-loss orders. Understanding why and how this happens transforms your perception of market volatility.
Step 1: Accumulation of Textbook Retail Orders
Retail technical analysts identify a clean triple-bottom support level on the 1-hour chart. Buyers flood into long positions, placing their protective stop-loss orders 15 pips below the swing lows. This creates a rich pool of sell-side liquidity consisting of thousands of resting sell stops.
Step 2: The Engineered Sweep
Institutional desks, knowing exactly where those retail stops reside, inject aggressive sell volume into the order book. Price rapidly plunges beneath the support level. Retail traders panic as their stop-losses execute, converting into market sell orders.
Step 3: Absorption and Reversal (The True Markup)
As retail sell orders flood the market, institutional algorithms absorb all that liquidity by executing massive buy orders at discounted prices. With their position filled seamlessly, the smart money drives the currency pair aggressively upward, leaving retail traders behind.
3. How to Spot Liquidity Pools Before They Are Raided
Recognizing where liquidity pools form requires shifting your analytical focus from finding entry signals to identifying where other market participants are vulnerable. Professional traders scan higher timeframes (Daily, 4-Hour, and 1-Hour charts) to locate structural reference points.
When price tests the exact same price level multiple times over several days, retail traders view it as an impregnable barrier. In reality, it is a flashing neon sign for institutional algorithms indicating a dense accumulation of stop orders.
During the low-volatility Asian trading session, currency pairs often consolidate within a tight range. Breakout traders set pending orders above and below this range heading into the London open, creating immediate liquidity pools prime for sweeping.
The absolute highest and lowest points of the previous week or month attract massive stop-loss volumes. Sweeping these levels often signals the initiation of a major weekly trend reversal or continuation phase.
Classic textbook diagonal trendlines touched three or more times create stacked stop-loss orders along the diagonal path. Algorithms frequently slice through these trendlines to harvest liquidity before resuming the true macro trend.
Retail Support/Resistance vs. Institutional Liquidity Analysis
Compare traditional retail trading assumptions against institutional order flow realities to understand why structural perspectives dictate profitability.
| Analytical Attribute | Retail Technical Analysis | Institutional Order Flow |
|---|---|---|
| View of Support | A floor where buyers step in automatically | A liquidity pool housing resting sell stops |
| Breakout Interpretation | Momentum continuation (Buy breakout) | Liquidity sweep to fill large institutional orders |
| Stop-Loss Placement | Directly behind obvious swing points | Placed beyond structural inducement zones or avoided entirely |
| Trading Objective | Trade chart patterns and indicator crossovers | Ride coattails of smart money after liquidity raids |
4. Actionable Strategies: How to Trade With the Smart Money
Knowing that institutions hunt liquidity allows you to stop playing the victim of market manipulation and start trading alongside institutional order flow. Here is a proven three-step execution framework used by professional currency traders.
Mark obvious equal highs, equal lows, and Asian session boundaries on your 4-hour and 1-hour charts. Acknowledge that these zones contain heavy retail stop-loss clusters.
Never enter a trade preemptively near support or resistance. Exercise patience and wait for price to aggressively spike through the liquidity pool, triggering the resting stop-losses.
Look for a rapid displacement candle or market structure shift (MSS) confirming price rejection back inside the range. Enter in the direction of the institutional reversal.
During active London session desk operations at fxone.online, we analyzed a textbook liquidity raid on EUR/USD. Asian session highs formed a clean double top at 1.0920, accumulating over $400 million in retail breakout buy stops and short stop-losses. Exactly at 8:00 AM UTC, institutional algorithms spiked price 18 pips above 1.0920, instantly sweeping all resting buy stops. Retail breakout traders rushed into long positions at the peak. Within fifteen minutes, institutional sellers flooded the order book, driving price downward by 70 pips in a violent reversal. Traders who recognized the liquidity sweep avoided the breakout trap and captured a high-probability reversal setup.
5. Protecting Your Capital Against False Breakouts
Trading liquidity pools requires strict risk management. Because stop hunts can be volatile, failing to protect your capital properly can result in unnecessary drawdowns. Keep these core principles in mind:
-
Never Place Stops Inside Liquidity Pools: Placing your stop loss right behind obvious swing highs or lows guarantees your position will be hunted during routine market volatility.
-
Wait for Confirmation Candles: Do not enter a trade the exact second price touches a level. Wait for a clear candlestick close or structural shift confirming the liquidity sweep has concluded.
-
Strictly Cap Position Risk at 1%: Maintain rigorous risk parameters. Even the most reliable institutional liquidity setups can occasionally fail due to unexpected macroeconomic news shocks.
Summary: Mastering Liquidity for Professional Consistency
Understanding liquidity pools and institutional stop hunts fundamentally changes how you navigate foreign exchange markets. Instead of viewing price action through the narrow lens of retail support and resistance, you begin to see currency charts as a map of institutional order accumulation. By exercising patience, identifying where retail stop-losses cluster, and waiting for liquidity sweeps before executing your entries, you align your trading strategy with the smart money operators who drive global currency trends.
About the Author: FX Research Team, fxone.online
The FX Research Team at fxone.online comprises institutional market analysts, macroeconomic forecasters, and veteran currency traders dedicated to elevating educational standards in retail foreign exchange. Our curriculum cuts through noise, focusing entirely on fundamental catalysts, risk metrics, and structural price mechanics.