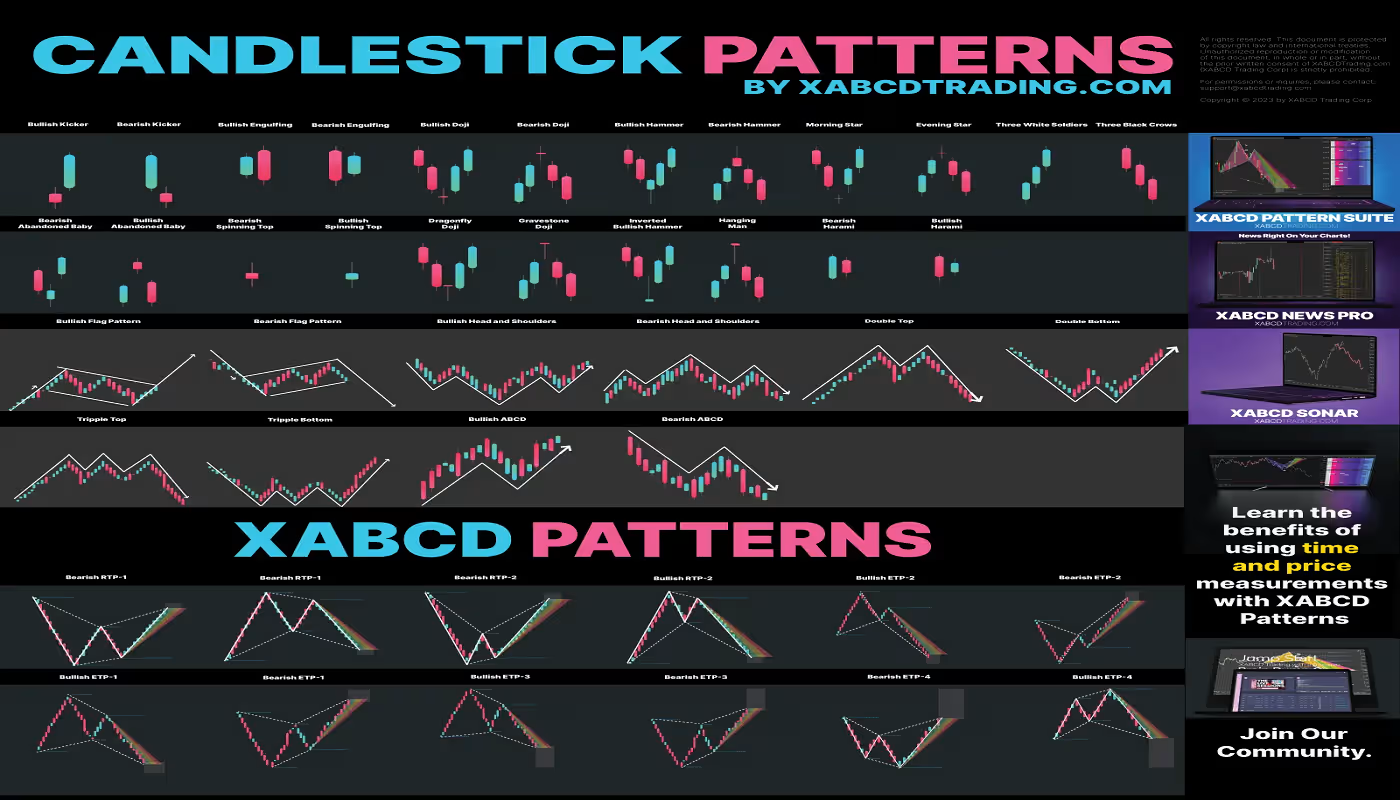
Introduction: Moving Beyond Basic Chart Patterns
To the untrained observer, a foreign exchange chart looks like a random series of green and red bars marching across a screen. Retail traders often fall into the trap of memorizing static textbook formations—such as "morning stars," "hanging men," or "shooting stars"—without understanding the underlying economic mechanics driving those shapes. When these isolated patterns fail during live sessions, traders blame technical analysis as a whole, unaware that they were merely looking at symptoms rather than the underlying institutional order flow.
Candlestick charts are not magical divination tools; they are a real-time behavioral record of buyer aggression, seller exhaustion, and institutional liquidity allocation. Originating in 18th-century Japanese rice markets and refined for modern electronic communication networks (ECNs), individual candlesticks capture the four battle points of a specific timeframe: the Open, the High, the Low, and the Close (OHLC). By learning to decode the velocity, shadow rejections, and body sizes of these candles, you gain the ability to read market sentiment directly from the tape.
1. Deconstructing the Single Candlestick: Open, High, Low, Close
Every single candlestick tells a micro-story of a battle fought between institutional bulls (buyers) and bears (sellers) over a defined window of time—whether that window is one minute, four hours, or a full daily trading session.
A bullish candle forms when buying pressure overcomes selling pressure during the session. The session opens at a specific price point, dips slightly to form the lower wick (if sellers briefly push lower), rallies aggressively to form the upper wick (highest point reached), and ultimately closes significantly higher than it opened. The solid body represents the net distance between the opening and closing prices.
A bearish candle tells the inverse story. The session opens, buyers may push price up briefly to form an upper wick, but aggressive institutional selling overwhelms bids. Price plunges past the opening price, reaches a session low (lower wick), and closes lower than it began. A large red body signals heavy distribution and dominant seller control.
The true power of reading candlesticks lies in comparing the relative size of the body to the wicks (shadows). Long wicks indicate price rejection—areas where limit orders were heavily defended by institutional participants, forcing price to reverse rapidly.
Visualizing Candlestick Formation and Order Book Matching
Watch this masterclass breakdown demonstrating how real-time order execution at institutional desks translates into multi-timeframe candlestick formations.
2. Shadows and Rejections: Where Smart Money Leaves Footprints
Amateur traders focus entirely on the candle body. Professional price action traders focus heavily on the wicks. Wicks represent price extremes that were rejected by the market before the candle period closed.
When a currency pair rallies toward a key resistance level and leaves a long upper wick, it reveals that institutional sellers stepped in with massive limit orders, absorbing all retail buying pressure and pushing price back down. Conversely, a long lower wick near a major support level indicates a liquidity sweep—where stop-loss orders from early sellers were triggered to fill large institutional buy orders before a sharp upward reversal.
Key Rule for Interpreting Wicks:
The longer the wick relative to the body, the stronger the rejection. A pin bar with a tail three times longer than its body appearing at a higher timeframe structural level provides one of the highest probability entry triggers in foreign exchange trading.
3. High-Probability Candlestick Patterns in Forex
While hundreds of candlestick patterns exist in trading literature, only a select few carry genuine institutional significance. Here are the core formations every professional forex trader monitors:
Characterized by a small body near one end and a long shadow extending in the opposite direction. It signals a failed auction. When price probes beyond a previous swing extreme and is instantly rejected, it shows that momentum has shifted entirely to the defending side.
A two-bar reversal pattern where the body of the second candle completely swallows (engulfs) the body of the preceding candle. A bullish engulfing candle at support indicates that aggressive buyers have completely overwhelmed previous sellers, seizing market control.
An inside bar occurs when the entire high-to-low range of a candle sits completely within the high-to-low range of the mother candle before it. This pattern reflects market compression, volatility contraction, and a buildup of pending breakout orders.
A Doji forms when the open and close prices are virtually identical. It represents equilibrium between buyers and sellers. When appearing after a strong directional trend, a Doji signals hesitation and potential exhaustion.
Candlestick Formation Reference Matrix
Analyze how specific candlestick structures correspond to underlying institutional order flow dynamics and market bias.
| Candlestick Formation | Structural Bias | Institutional Order Flow Meaning | Best Context / Location |
|---|---|---|---|
| Bullish Pin Bar | Bullish Reversal | Stop hunt below support, absorption of sell orders | Key daily support level or order block |
| Bearish Engulfing | Bearish Reversal | Aggressive distribution, institutional block trading | Major resistance or liquidity pool sweep |
| Inside Bar Breakout | Continuation / Expansion | Volatility compression before order release | Trend continuation following a pullback |
| Dragonfly Doji | Neutral / Reversal | Sellers pushed lower but buyers reclaimed ground | Key demand zone during London open |
4. Context is King: Location Over Pattern Shape
The single biggest mistake retail traders make is trading candlestick patterns in a vacuum. A pin bar or engulfing candle appearing in the middle of a random chart range holds zero statistical edge. Candlesticks must be evaluated based on location.
An identical pin bar can produce completely opposite outcomes depending on where it forms:
-
High-Probability Location: A pin bar forming directly on a higher-timeframe 4-hour order block or liquidity pool during the active London trading session. Institutional interest is concentrated here.
-
Low-Probability Location: The exact same pin bar forming mid-range with no supporting structural level during a quiet holiday session. It will likely fail due to lack of institutional participation.
5. Multi-Timeframe Candlestick Synergy
Professional traders do not look at timeframes in isolation. A 15-minute chart candlestick is merely a microscopic breakdown of what is happening inside a single 4-hour or daily candle.
When analyzing currency pairs like EUR/USD or GBP/JPY, start your top-down analysis on the Daily and 4-Hour charts to identify structural trends and key order blocks. Once higher-timeframe candlesticks indicate a clear directional bias or rejection, drop down to the 15-minute or 5-minute chart to look for localized candlestick triggers (such as a minor engulfing pattern or pin bar) that allow you to enter with an extremely tight stop-loss and an optimized risk-to-reward ratio.
Summary: Mastering the Tape
Reading candlesticks is an acquired skill that requires patience, rigorous chart time, and strict attention to market context. By viewing candlesticks as a real-time record of buyer and seller aggression rather than rigid geometric shapes, you transform your trading approach. Always pair candlestick analysis with higher-timeframe structure, session liquidity windows, and strict risk management rules.
About the Author: FX Research Team, fxone.online
The FX Research Team at fxone.online comprises institutional market analysts, algorithmic execution specialists, and veteran macro traders dedicated to raising educational standards in retail foreign exchange. Our curriculum cuts through noise, focusing entirely on institutional order flow, risk metrics, and structural price mechanics.