Introduction: Moving Beyond Random Notes to Quantitative Accountability
In the institutional architecture of global foreign exchange desks, a trading journal is not merely a rudimentary diary used to jot down entry prices and emotional feelings after a losing session. It functions as a sophisticated quantitative database, a clinical audit tool, and a rigorous performance analytics engine designed to isolate behavioral leaks, refine mathematical expectancy, and eliminate repeated operational errors. Retail participants routinely fail because they treat trading as an intuitive art form, reviewing their charts only when accounts face severe margin distress. In contrast, elite hedge fund managers treat every single trade execution as a distinct data point within a vast statistical matrix.
This masterclass blueprint explores the core mechanics of building, maintaining, and analyzing a professional, institutional-grade trading journal. By incorporating quantitative metrics such as profit factor, expectancy ratios, maximum adverse excursion (MAE), and behavioral tagging, you will transform raw historical data into a tangible competitive advantage. Understanding how to systematically log your executions ensures that you stop guessing why your strategy fluctuates and start engineering long-term profitability.
1. The Core Architecture: Deconstructing the Four Pillars of Journal Analytics
A professional journal must go far beyond tracking whether a trade hit its profit target or stop-loss. Institutional logging frameworks categorize data into four essential pillars, ensuring that every variable influencing market performance is captured for post-session analysis.
Recording hard numbers including exact timestamp, currency pair, position size, initial risk-to-reward ratio, slippage costs, commission fees, and final net profit or loss in percentage terms.
Logging prevailing macroeconomic catalysts, higher-timeframe market structure conditions, session timing (e.g., London breakout vs. Asian range), and volatility states during execution.
Evaluating psychological composure on a scale of 1 to 5, tracking emotional states such as patience, fear of missing out (FOMO), or revenge tendencies immediately before and after order placement.
Attaching multi-timeframe screenshots (higher-timeframe bias view and lower-timeframe execution view) both upon entry and after trade closure to enable visual pattern recognition reviews.
When these four pillars are integrated into a single spreadsheet or specialized software tool, your journal shifts from a passive record keeper into an active diagnostic instrument.
Journaling Framework Matrix: Basic Retail Diary vs. Institutional Database
fxone.online research labThe comparative breakdown below illustrates the operational divide between casual record-keeping and data-driven institutional logging.
2. Implementation Manual: Step-by-Step Guide to Setting Up Your Journal
Designing a high-performance trading journal requires structured consistency. Whether you choose to build a customized Notion database, an advanced Microsoft Excel workbook, or use specialized third-party analytics software, your logging template must remain uniform across every single transaction.
Follow this sequential setup checklist to establish your professional journaling system:
-
Define Standard Data Input Fields: Create columns for Date, Session, Asset Pair, Direction (Long/Short), Setup Type (e.g., Order Block, FVG), Planned Risk ($ and %), Execution Price, Stop Loss, Take Profit, Exit Price, and Net R-Multiple.
-
Implement Behavioral Tagging Categories: Add mandatory tags for psychological state during execution. Use clear tags such as "Compliant with Plan," "FOMO Entry," "Revenge Trade," "Moved Stop Loss," or "Early Profit Take."
-
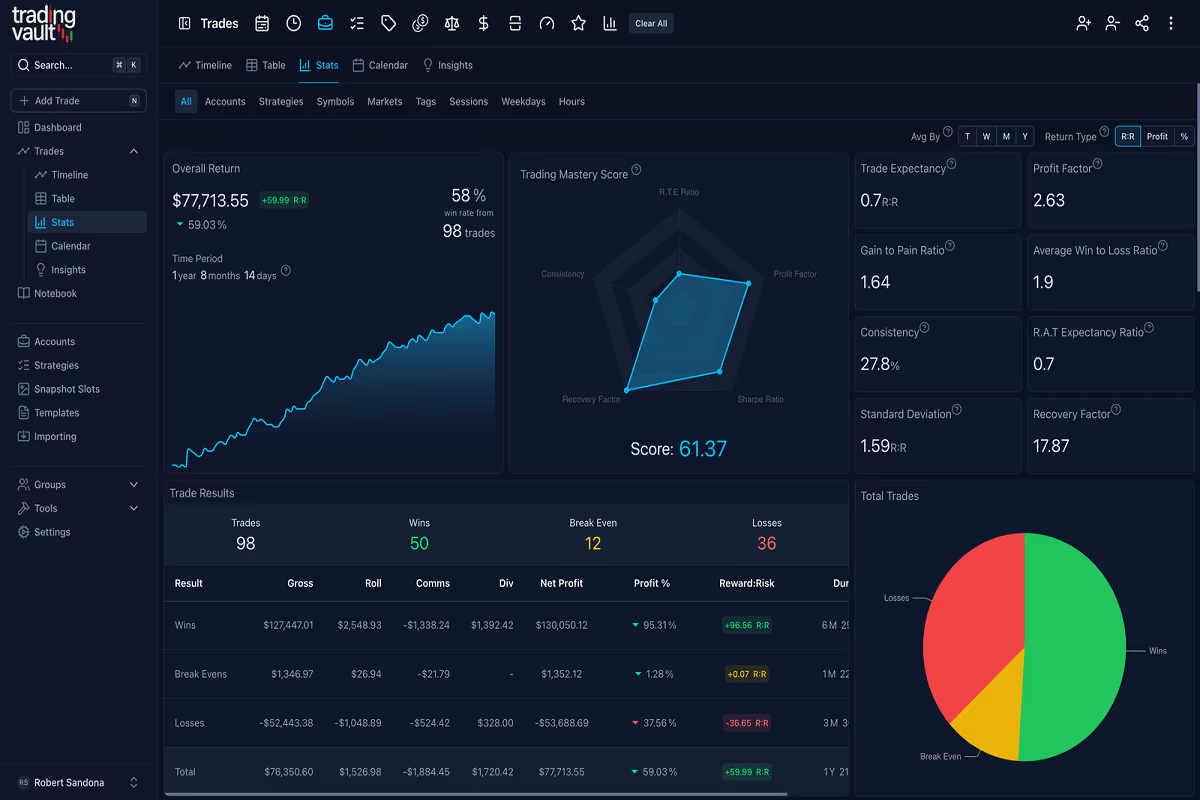
Incorporate Automated Summary Dashboards: Program your spreadsheet formulas to auto-calculate critical metrics: Win Rate percentage, Profit Factor (Gross Profits divided by Gross Losses), Average R-Multiple per win vs. loss, and Expectancy per trade.
-
Mandate Post-Trade Screenshot Archives: Establish a rule that no trade is officially logged until two chart image links (pre-entry structure and post-exit result) are permanently embedded into the row entry.
Maintaining this rigorous data entry habit removes subjective bias and forces you to confront the cold, mathematical reality of your execution performance.
Visual Masterclass: Building and Analyzing an Institutional Trading Journal
Watch this detailed analytical presentation examining how professional currency desks track execution metrics, review quantitative data dashboards, and systematically eliminate recurring trading mistakes.
3. Quantitative Auditing: Analyzing Performance Metrics and Tracking Errors
Logging data is only the first step; the true value of an institutional trading journal lies in conducting deep statistical audits. By evaluating rolling blocks of 50 to 100 trades, you can uncover hidden leaks that drain your equity curve.
Focus your weekly and monthly audits on these four advanced institutional metrics:
-
Profit Factor Evaluation: Calculate your total gross winnings divided by total gross losses. A profit factor above 1.5 indicates a solid trading edge, while a score below 1.2 requires immediate review of entry or exit rules.
-
Expectancy Math Tracking: Use the standard institutional formula to determine the average dollar return per dollar risked: $\text{Expectancy} = (\text{Win Probability} \times \text{Average Win}) - (\text{Loss Probability} \times \text{Average Loss})$. Ensure your system yields a positive mathematical expectation.
-
Maximum Adverse Excursion (MAE) Analysis: Review how far price moved against your entry before reversing. If your MAE data shows that trades frequently endure deep drawdowns before winning, your entry timing or stop-loss placement needs adjustment.
-
Behavioral Mistake Tag Sorting: Filter your journal entries by psychological tags. If trades tagged with "FOMO Entry" account for 70% of your net losses, you have isolated the exact psychological leak sabotaging your account.
Quantifying your mistakes transforms abstract emotional frustration into actionable data points that you can systematically eliminate from your execution routine.
Comparative Matrix: Reactive Trader vs. Institutional Journal Auditor
Review the clear operational distinctions in review habits, data tracking, and continuous improvement between reactive retail traders and institutional journal auditors.
| Evaluation Metric | Reactive Retail Trader Approach | Institutional Journal Auditor Protocol | Long-Term Impact on Account |
|---|---|---|---|
| Post-Trade Review | Closes platform immediately after a loss; refuses to look at charts | Logs exact execution metrics, psychological score, and chart screenshots | Transforms losses into objective learning lessons |
| Data Aggregation | Relies on broker account balance summary numbers | Calculates rolling profit factors, expectancy, and MAE metrics | Provides clear visibility into true statistical edge |
| Mistake Correction | Repeats identical emotional errors across consecutive weeks | Sorts behavioral tags to isolate and eliminate specific execution leaks | Accelerates mastery and capital preservation |
During an institutional research audit conducted by the fxone.online analytical team, we tracked two independent currency traders experiencing prolonged performance stagnation. Trader Marcus maintained a basic spreadsheet recording only entry price, exit price, and net dollar profit, remaining unaware that his account was slowly bleeding capital due to excessive slippage and premature profit-taking. In contrast, trader Samantha implemented our complete institutional journaling framework, including behavioral tagging, session filters, and multi-timeframe chart screenshot archives. During her monthly 100-trade review, Samantha's database analytics revealed a striking pattern: trades executed during the quiet Asian consolidation session and tagged with the emotional note "Impulsive Boredom Entry" accounted for 85% of her cumulative net losses. Furthermore, her MAE analytics showed that trades where she manually closed winners early had an average potential reward of 3.5R that she truncated into 0.8R gains. Armed with these precise quantitative insights, Samantha amended her trading plan to strictly ban trading during Asian session lulls and automated her profit-taking targets to prevent emotional interference. Within 60 days of eliminating these journal-identified leaks, Samantha's profit factor surged from 1.1 to 2.4, propelling her account into consistent institutional profitability. This case study highlights that sustainable success in foreign exchange trading belongs entirely to those who leverage detailed journal analytics to isolate and destroy behavioral errors.
4. Habit Engineering: Maintaining Daily Journaling Discipline
The greatest institutional trading journal in the world holds zero value if you lack the discipline to maintain consistent data entries. Building a journaling habit requires anchoring the task directly to your daily trading routine.
-
Immediate Post-Execution Logging: Never leave trade logging for the end of the week. Enter quantitative data and screenshot links immediately after closing a position while market context and psychological state remain fresh in your mind.
-
Weekly Analytical Reviews: Dedicate 60 minutes every weekend to review your rolling performance metrics. Analyze your winning setups vs. losing tags to identify emerging market tendencies.
-
Continuous Rule Refinement: Use weekend journal insights to update your operational trading plan. Treat your journal as the primary feedback loop that guides your evolution as a currency trader.
Treating your trading journal with the same professional rigor as an institutional risk audit is the definitive bridge between struggling retail speculation and long-term financial mastery.
Frequently Asked Questions
What are the essential fields to include in an institutional trading journal?
Essential fields include exact timestamps, asset pairs, setup classifications, planned risk-to-reward ratios, net R-multiples, psychological behavioral tags, and multi-timeframe chart screenshot links to enable objective visual reviews.
How often should I review my trading journal data?
Institutional desks require daily trade logging, weekly analytical reviews of rolling performance metrics (such as profit factor and expectancy), and comprehensive quarterly audits to refine strategy execution parameters.
Summary: Securing Long-Term Consistency Through Data Accountability
Building and maintaining an institutional trading journal is the ultimate differentiator between retail account failure and sustainable market longevity. By tracking quantitative execution metrics, contextual market environments, behavioral psychological tags, and visual chart archives, you eliminate the emotional blind spots that drain trading capital. True market mastery is not achieved by avoiding losses entirely, but by systematically logging, analyzing, and eliminating recurring mistakes over hundreds of structured trade executions.
About the Author: FX Research Team, fxone.online
The FX Research Team at fxone.online comprises institutional market analysts, macroeconomic forecasters, and veteran currency traders dedicated to elevating educational standards in retail foreign exchange. Our curriculum cuts through noise, focusing entirely on fundamental catalysts, risk metrics, and structural price mechanics.