Introduction: The Architecture of Market Movement – Moving Beyond Simple Trendlines
In the study of retail foreign exchange technical analysis, almost every aspiring trader is introduced to trends through the lens of connecting diagonal lines across chart peaks and valleys. Textbooks instruct participants to draw a straight line along consecutive swing lows in an uptrend, or swing highs in a downtrend, and execute trades every time price touches that boundary. While this conceptual framework provides a basic introduction to directional market bias, relying exclusively on subjective diagonal lines frequently leads to repeated frustration. Modern institutional algorithms, operated by primary dealers, central bank desks, and multi-billion-dollar hedge funds, routinely slice through retail trendlines to harvest liquidity before resuming the true macroeconomic trend.
To evolve from a struggling retail participant into a disciplined, consistent currency trader, you must redefine how you map market structure. Trends are not defined by neat geometric lines drawn on a computer screen; they are defined by the continuous generation of structural milestones—specifically, higher highs and higher lows in a bullish expansion, or lower lows and lower highs in a bearish contraction. This comprehensive manual explores the structural mechanics of trend identification from an institutional perspective, teaching you how to differentiate genuine breaks of structure (BOS) from false liquidity raids, harness multi-timeframe alignment, and integrate robust structural mapping into your daily execution strategy.
1. The Core Anatomy of Market Structure: Defining Swings, HH, HL, LH, and LL
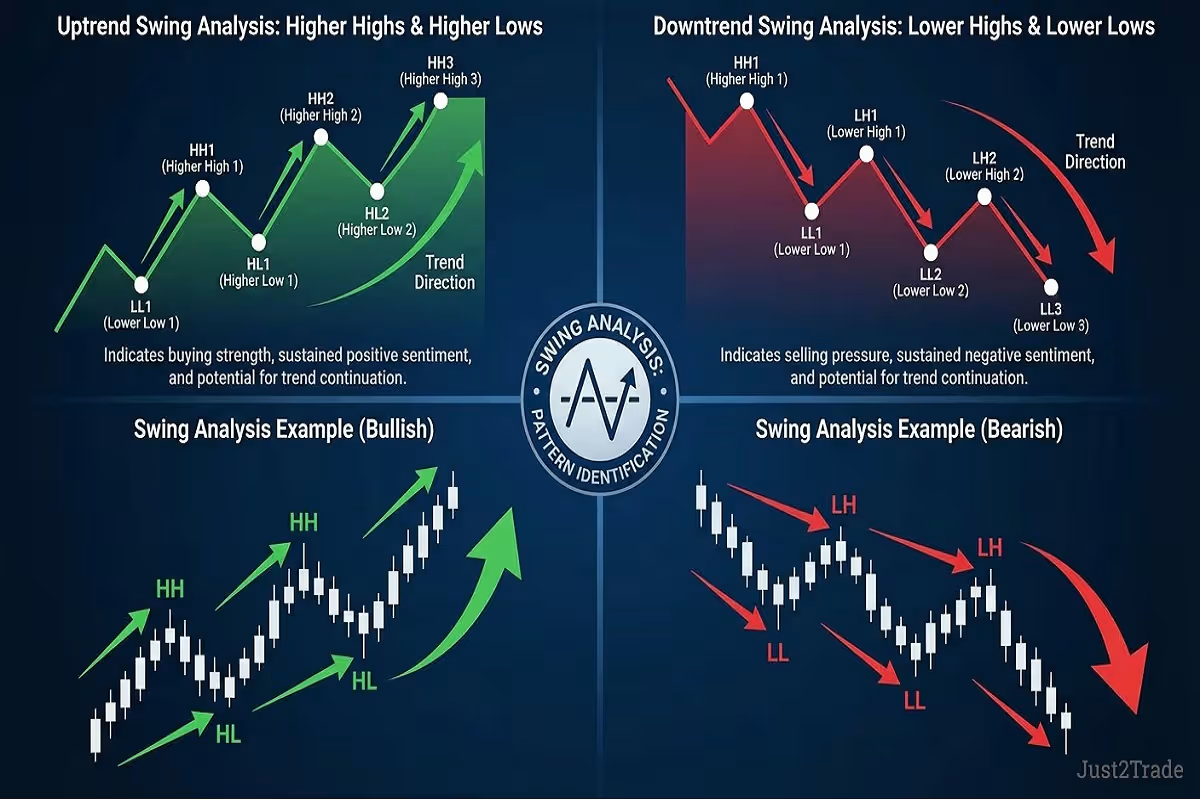
At its core, financial market structure is a objective record of order flow dominance. Price never moves in a straight vertical line; instead, it advances through a series of impulse waves (expansion in the direction of the dominant trend) and retracement waves (temporary pullbacks where profit-taking and counter-trend orders temporarily balance the book).
Defined by a sequence of Higher Highs (HH) and Higher Lows (HL). Each impulse wave breaks previous resistance ceilings, while each retracement phase stops short of the prior low, reflecting aggressive institutional accumulation.
Characterized by a sequence of Lower Lows (LL) and Lower Highs (LH). Each downward impulse wave shatters previous support floors, while rallies fail to reclaim previous peak pricing, indicating heavy institutional distribution.
Mastering the identification of these swing points requires strict objectivity. A swing high is established only when a candle's high is flanked by lower highs on both its left and right sides across your chosen timeframe. Conversely, a swing low requires a candle's low to be flanked by higher lows on both sides. Recognizing these pivotal turning points allows traders to map the exact structural boundary where market control shifts between buyers and sellers.
Reference Blueprint: Retail Trendlines vs. Institutional Market Structure
fxone.online research labBelow is a structural contrast detailing how retail traders misinterpret market momentum through diagonal lines compared to how institutional desks track swing structure.
2. Advanced Mapping: Breaks of Structure (BOS) and Changes of Character (CHoCH)
Moving beyond basic higher highs and lower lows requires understanding structural transitions. Institutional price action analysis utilizes two primary structural events: the Break of Structure (BOS) and the Change of Character (CHoCH).
The two core structural signals monitored by professional currency desks include:
-
Break of Structure (BOS): A BOS occurs when price continues in the direction of the established trend by breaking through a prior swing high (in a bull trend) or swing low (in a bear trend). This confirms that institutional momentum remains intact and that the primary trend is continuing.
-
Change of Character (CHoCH): A CHoCH represents an early warning signal of a potential trend reversal. In an ongoing uptrend, price typically generates higher highs and higher lows. When a retracement violates the most recent valid higher low and closes decisively beneath it, a CHoCH is triggered, signaling that institutional order flow has shifted from bullish accumulation to distribution.
-
Internal vs. External Structure: Professional traders separate internal market structure (minor swing points on 1-minute to 15-minute charts) from external market structure (major swing points on 4-hour and Daily charts). Aligning internal pullbacks with external structural bias drastically improves win-rate expectancy.
Recognizing the difference between a BOS and a CHoCH prevents traders from entering counter-trend positions prematurely during healthy pullbacks, ensuring that entries are only taken when institutional confirmation is fully established.
Visual Masterclass: Mapping Higher Highs, Lower Lows, and Structural Shifts
Watch this intensive visual masterclass breaking down how institutional algorithms engineer market structure breaks across major currency pairs during active London and New York sessions.
3. Multi-Timeframe Trend Alignment: Connecting Macro Bias with Execution Charts
One of the most common mistakes made by retail currency traders is analyzing a chart on a single timeframe—such as staring exclusively at a 5-minute chart. This creates a myopic perspective where every minor pullback looks like a major trend reversal. Professional institutional desks operate using a top-down analytical framework, ensuring that lower-timeframe executions strictly align with higher-timeframe structural bias.
To implement multi-timeframe trend alignment successfully, follow this three-tier analytical sequence:
-
Macro Structural Bias (Daily & 4-Hour Charts): Identify the dominant market trend by locating the prevailing higher highs and higher lows. If the Daily chart is printing clear bullish structural breaks, your trading mandate for that currency pair is strictly to look for buying opportunities.
-
Intermediate Retracement Zone (1-Hour Chart): Wait for price to pull back into a discount array (such as an institutional order block or fair value gap) within the higher-timeframe trend. Monitor this timeframe for a structural shift to signal the end of the pullback.
-
Precision Execution (5-Minute or 15-Minute Chart): Drop down to lower timeframes to identify a precise Change of Character (CHoCH) that signals the resumption of the primary trend, allowing for tight stop-loss placement and exceptional risk-to-reward ratios.
When your execution timeframe harmonizes with the Daily and 4-hour structural bias, your trades benefit from the full weight of institutional momentum, drastically increasing your overall win-rate expectancy.
Comparative Analysis: Retail Trendlines vs. Institutional Market Structure
Examine how traditional retail trendline models contrast against professional institutional market structure frameworks.
| Evaluation Parameter | Traditional Retail Trendline Approach | Institutional Market Structure Framework |
|---|---|---|
| Boundary Definition | Diagonal lines connecting arbitrary candle wicks | Horizontal swing high and swing low structural prints |
| Break Reaction | Triggers immediate emotional breakout entries | Identifies BOS and CHoCH to confirm true order flow shifts |
| Stop-Loss Placement | Placed tightly behind diagonal trendline touches | Positioned securely beyond valid structural higher lows/lower highs |
| Timeframe Synergy | Single timeframe focus prone to noise | Top-down multi-timeframe alignment (Daily to 5M) |
During active New York session operations at fxone.online, our research desk analyzed a textbook structural transition on USD/JPY. The Daily and 4-hour charts had been locked in a robust bullish trend characterized by consecutive higher highs and higher lows. However, during the Asian and early London sessions, price experienced a sharp corrective pullback, printing a lower high and breaking beneath the most recent 1-hour higher low at 154.20, triggering a valid Change of Character (CHoCH). While retail breakout traders rushed to sell the breakdown, our institutional framework recognized that price had simply tapped a Daily bullish order block. By waiting for a 15-minute structural shift back to the upside, our desk executed long positions with a tight 18-pip stop-loss, capturing a subsequent 110-pip impulse rally as the primary daily trend resumed.
4. Risk Management, False Structural Breaks, and Trap Avoidance
Trading market structure successfully requires rigorous risk management protocols. Because major swing points attract intense institutional liquidity and stop hunts, entering positions without proper confirmation or risk parameters can result in rapid drawdowns. To safeguard your trading capital, adhere to these four core risk rules:
-
Require Candlestick Body Closes: Never classify a break of structure based on a wick puncture alone. Institutional algorithms frequently push wicks past key swing points to sweep retail stops. Always wait for a definitive candle body close beyond the structural level to confirm a valid BOS or CHoCH.
-
Account for Spread and Market Volatility: Major currency pairs experience temporary spread widening during macroeconomic news releases and session openings. Ensure your stop-loss buffers account for potential spread expansion.
-
Protect Against Liquidity Sweeps: Place your protective stop-loss orders safely beyond the structural wick extreme or liquidity pool boundary rather than tightly hugging the swing low or high.
-
Strict Position Sizing (1% Rule): Limit your maximum financial risk per trade to 1% or less of total account equity, ensuring absolute resilience through inevitable losing sequences.
Frequently Asked Questions
How do I distinguish between a minor pullback and a true trend reversal?
A minor pullback will retrace within a bullish trend without breaking the most recent higher low. A true trend reversal (Change of Character) occurs when price breaks and closes decisively below that critical higher low structure, signaling institutional distribution.
Which timeframe should I use to identify market structure?
Professional traders use a top-down approach. The Daily and 4-hour charts establish the macro trend structure, while 1-hour and 15-minute charts are utilized to identify execution points and internal structural shifts.
Summary: Mastering Trend Structure with Institutional Precision
Mastering market structure, higher highs, lower lows, and structural breaks transforms your analytical perspective from a retail guesser to an institutional tactician. By recognizing that trends are defined by objective swing points and order flow shifts rather than subjective diagonal lines, you can successfully navigate false breakouts, avoid stop hunts, and align your trade executions with smart money momentum.
About the Author: FX Research Team, fxone.online
The FX Research Team at fxone.online comprises institutional market analysts, macroeconomic forecasters, and veteran currency traders dedicated to elevating educational standards in retail foreign exchange. Our curriculum cuts through noise, focusing entirely on fundamental catalysts, risk metrics, and structural price mechanics.